D i g i t a l _ E a r t h
Data Exploration Framework
WP2 addressed challenges related to data provision and data analysis. As illustrated in the two Show Cases approaches were required e.g. to access quality controlled real-time data, to close data gaps, to upscale data, or to combine data that have a large variety in spatial and temporal scale. The strategy of WP2 was to meet the requirements via designing methods and workflows that enable natural scientists to make use of streamlined data flows as well as tailored visual data exploration and machine learning approaches.
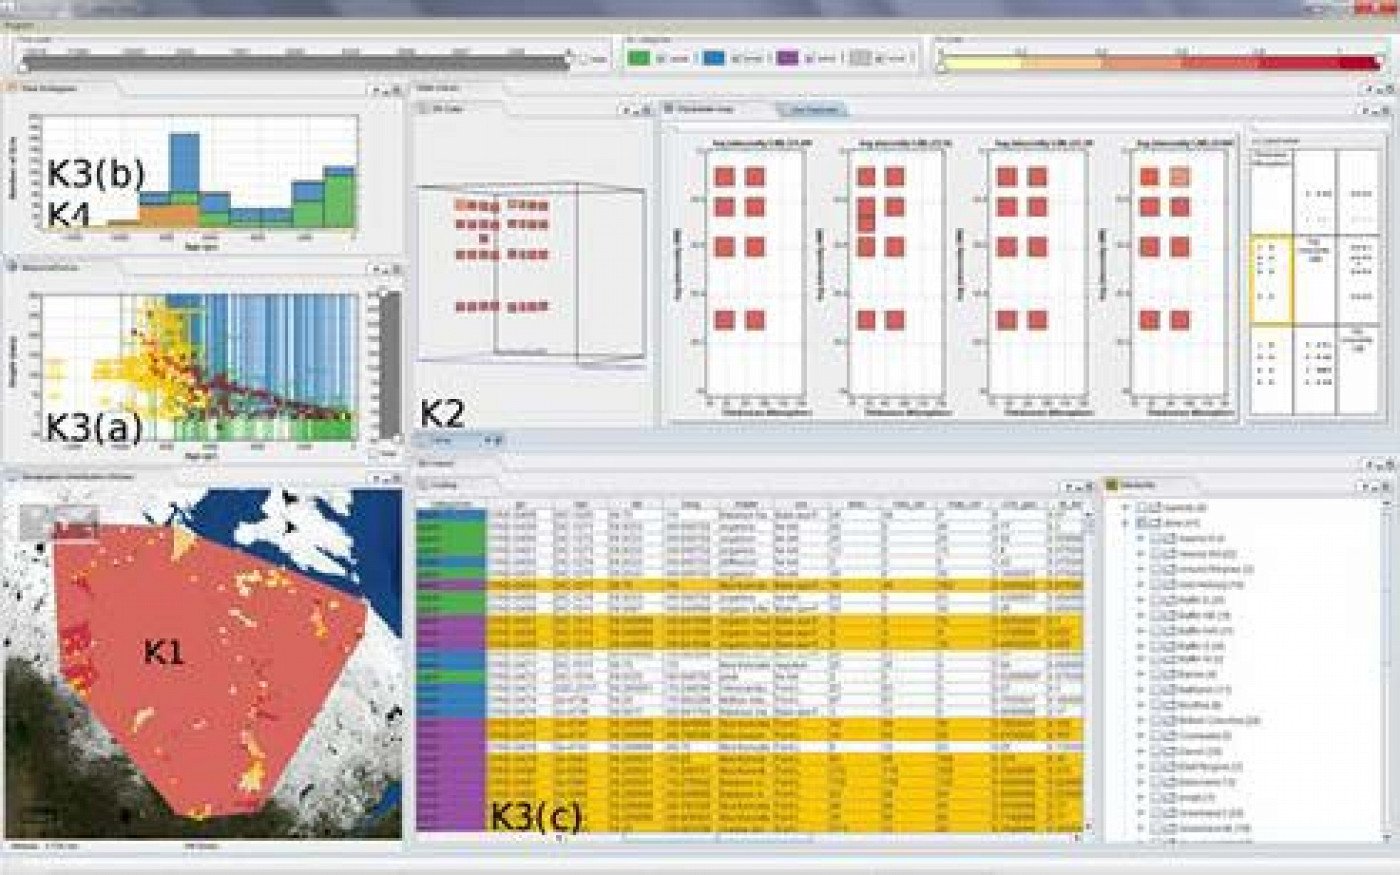
 Example of an interactive visual exploration tool to support scientists validating simulation models (from Unger et al 2012). Various linked views to the data (K1-K4) allow e.g. to exploring goodness of fit of observation and simulation data in space (K1) and interactively exploration of observation and simulation data with respect to different model input parameter values (K2). Others provide frequency distribution (K3a) or visual comparison of observation and simulation data by optionally overlaying both data (K4).